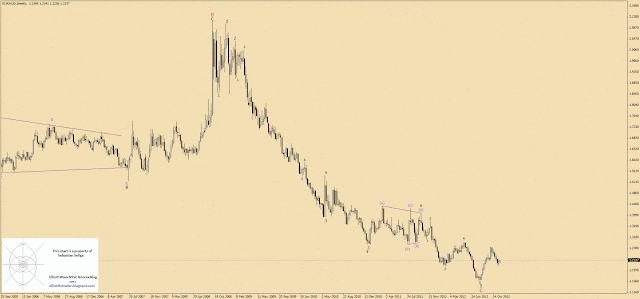
Main count is weekly chart, where price had reached the bottom for wave C and now we suppose to be in impulsive recovery faze: wave 1 to the upside had been done. Now we are in some corrective mode, so far it looks like (a)(b)(c).
Please notice that there is an alternative count on H4 chart: it says waves to the downside are not finished yet. Nevertheless, if thick blue line will be broken then low for corrective wave 2 to the downside has been found and new high should be anticipated.
Non-Linear Regression Models from H4 time frame chart confirms more upside action should be expected. On Daily chart channel points towards bottom of the range indicating that price has reached confidence interval. Weekly charts clearly shows the progression of the regression towards the downside.
Seb


ليست هناك تعليقات:
إرسال تعليق